

You are here
Back to topAustralia’s Table Grape Exports to China Plunge Nearly 40% in 2025/26
November 17, 2026



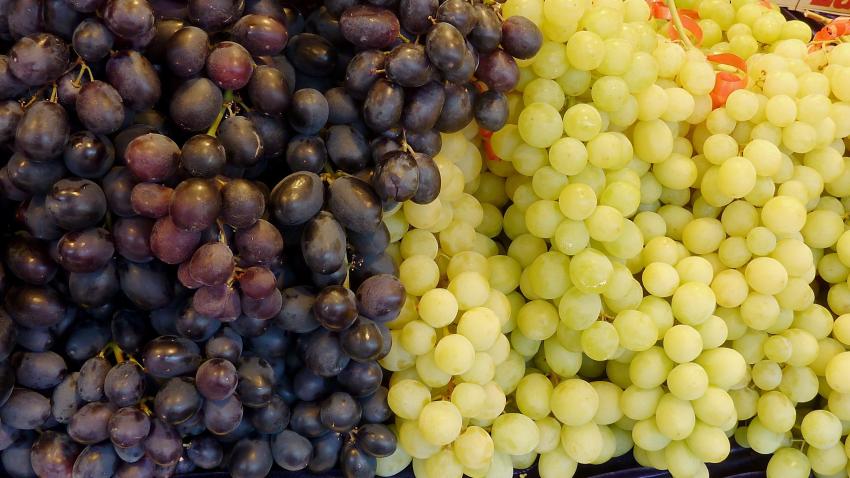
Following the heavy rainfall that affected the industry during marketing year 2025/26 (October to September), Australia’s table grape sector is gradually recovering. According to the latest Australia: Fresh Deciduous Fruit Annual report released by the U.S. Department of Agriculture’s Foreign Agricultural Service, Australian table grape production is forecast to rebound to 205,000 metric tons in MY 2026/27, while exports are expected to reach 120,000 metric tons.
Regarding exports to China, Australia’s shipments to this market declined significantly in MY 2025/26, allowing Indonesia to overtake China as Australia’s largest export destination. Nevertheless, Australia remains the largest supplier of imported table grapes to China.
Limited Recovery in Production
The forecast production for MY 2026/27 represents a 5.1% increase from the estimated 195,000 metric tons in MY 2025/26. However, it remains 24,000 metric tons, or approximately 10.5%, below the 229,000 metric tons recorded in MY 2024/25.
The report noted that Australia’s table grape production in MY 2025/26 was initially forecast at 210,000 metric tons but was later revised downward by 15,000 metric tons to 195,000 metric tons owing to heavy rainfall during the harvest period.
On March 1 and 2, 2026, parts of Australia’s major table grape-growing regions, including Sunraysia, the Murray Valley and parts of the Riverina, experienced heavy rainfall, with precipitation totals reaching approximately 100–150 millimeters. These regions collectively account for around 85% of Australia’s total table grape production. As the rainfall occurred during a critical stage of the harvest, it resulted in fruit damage, lower marketable yields and overall production losses.
Indonesia Overtakes China as Top Overseas Market
Australia’s table grape exports in MY 2026/27 are forecast to reach 120,000 metric tons, up 2.0% from the estimated 117,600 metric tons in MY 2025/26. Despite an expected 5.1% increase in production, improved fruit quality and a recovery in domestic consumption are expected to temper export growth.
The MY 2025/26 export estimate of 117,600 metric tons represents a downward revision of 2.0% from a previous forecast of 120,000 metric tons. According to the report, this indicates relatively resilient performance considering the damage caused by heavy rainfall in March 2026, partly because lower-quality grapes also entered export channels. As almost all of Australia’s table grape exports take place between January and June, trade data for the first 11 months of the marketing year already provide a fairly reliable indication of the final annual result.
Australia exports table grapes to approximately 35 markets, with the top five destinations accounting for around 70% of total shipments. In MY 2025/26, Indonesia overtook China to become Australia’s largest export market. According to the report, during the October to July comparison period, shipments to China fell from 44,800 metric tons to 28,000 metric tons, a decline of 37.5%. Meanwhile, exports to Indonesia rose from 28,200 metric tons to 29,100 metric tons.
Australia Remains China’s Largest Supplier
Despite the significant shift in trade patterns during MY 2025/26, Australia remains China’s largest supplier of imported table grapes. Among the three suppliers covered in the report, namely, Chile, Peru and Australia, Australia has maintained its leading position since MY 2024/25. During the October to July period of MY 2025/26, Australian shipments to China declined by 38%. However, imports from Chile and Peru also recorded significant declines.
The report identifies two main factors behind China’s weakening demand for imported table grapes. First, China’s domestic production continues to expand. Since Australia’s record export season, China’s table grape production has increased by 52%, while imports have declined by 62% over the same period. Chinese growers are also expanding their cultivation of new non-dormant grape varieties in tropical regions, extending the domestic production window. Meanwhile, growing cold storage capacity has lengthened the domestic marketing season, ensuring a more consistent year-round supply and narrowing the market window for counter-seasonal imports from the Southern Hemisphere.
Second, South American suppliers are increasingly focusing on the U.S. market. Chile’s table grape production has declined due to competition from Peru and lower returns in the U.S. market, prompting some growers to shift to walnuts, cherries and citrus. By contrast, Peru’s table grape production continues to expand, supported by favorable climatic conditions and investment in irrigation. Both Chile and Peru are placing greater emphasis on the geographically closer U.S. market, which has, to some extent, supported Australia’s share of China’s import market.
Australia also retains a logistical advantage. The report notes that shipping distances from Australia to China are shorter than those from South American competitors, which is beneficial for Australian exporters. This is another important reason why Australia remains China’s largest table grape supplier despite the overall contraction in China’s import market.
Image: Pixabay
This article was translated from Chinese. Read the original article.

Topics:
Produce:



-
November 17, 2026
-
November 15, 2026
-
November 12, 2026
-
November 12, 2026
-
November 11, 2026
-
October 20, 2026
-
October 19, 2026
-
October 21, 2026
-
October 27, 2026
-
October 22, 2026
Featured Produce

Produce Marketplace
- Pujiang Tangguo Agri · China
- Pujiang Tangguo Agri · China
- Pujiang Tangguo Agri · China
- Hainan ITG Logistics · A26,Haikou
- Joshua Lim · Malaysia
- City fresh fruit co. · Thailand

Add new comment